

Your Coneberry Dashboard: Track Every Link, Order and Result

Buying publicity usually ends with a messy folder: links in emails, screenshots in chat, a spreadsheet someone forgot to update. When your boss or client asks “where have we been published?”, you spend an hour finding out. The Coneberry dashboard was built to remove that hour.
Coneberry is one place to get articles and press releases published on real news and business websites, so your brand builds reputation and authority online, gets found when people search for it and shows up in AI answers. Your dashboard is the home page of that work. This guide walks through what you see there, what each number means and how to use it to report results and plan what to publish next.
The dashboard in one view
When you log in, the dashboard opens with four headline numbers. They give a fast answer to “how are we doing?” without opening a single order.
Also worth a look: Refunds and Cancellations for Guest Posts and Press Releases: What to Expect and After Publication: What to Do With Your Live Links and Reports.
- Links published counts articles that are live for you, and how many more are on the way.
- Orders placed shows all your orders and how many are still in progress.
- Total invested is what you have paid, with the cost per published link beside it.
- Combined readership adds up the monthly visitors of the publications that feature you.
Combined readership is an estimate of reach, based on traffic figures from third-party tools, so treat it as a guide rather than a promise. The article on traffic numbers explains why.
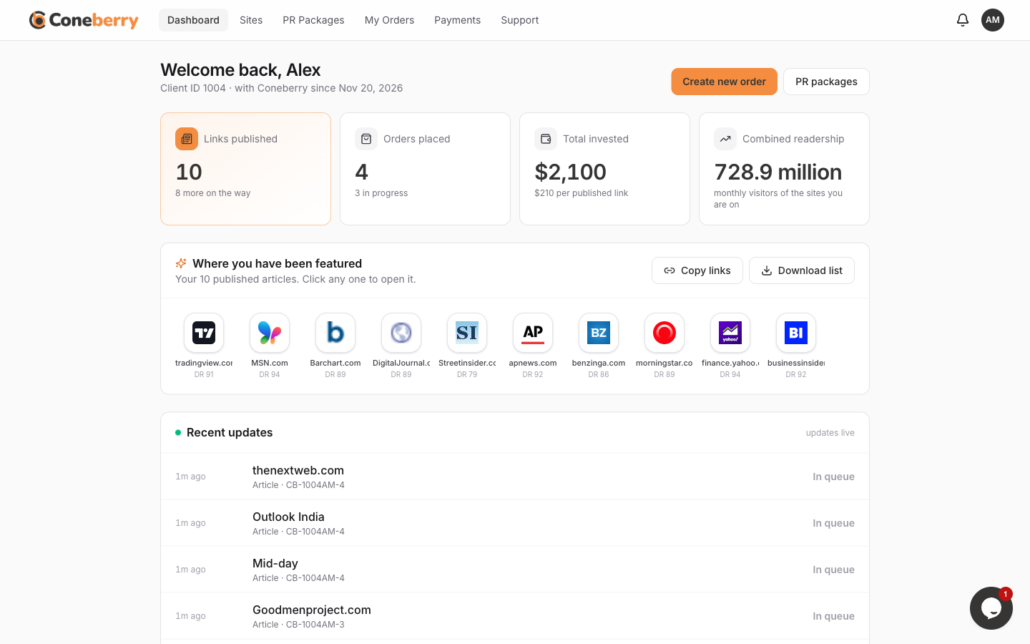
The dashboard opens with your headline results.
A wall of the places you have been featured
Under the numbers is a wall of logos, one for every publication that has published you. Click a logo to open the live article. This is the part most people screenshot for a presentation, and it makes a convincing “as seen on” view of your real coverage.
Two buttons sit beside it. Copy links copies every live link so you can paste them into an email or report. Download list gives you a CSV spreadsheet with the date, the publication, its DR, traffic, link type (do-follow or no-follow) and country for each link. If you report results to someone, this file is most of your report.
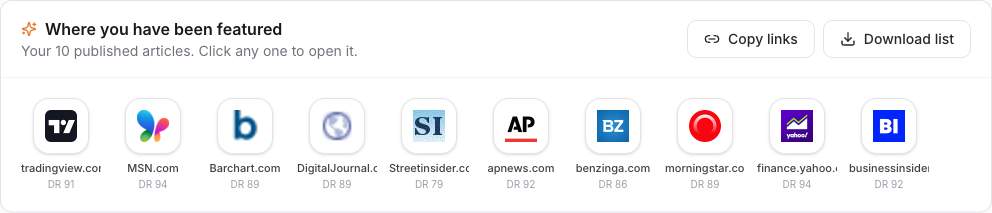
Logos of every publication you appear on, with Copy links and Download list.
Recent updates: follow every site live
Each order can involve many sites, and each site moves at its own pace. The Recent updates list shows every site in every order with its latest status: In queue, Submitted, Publishing, Published or Rejected. It refreshes by itself every few seconds while the page is open, so you can watch progress without reloading. Click a row to jump to its order.
If a publication declines content, you will see it here and in the order chat, and the team arranges a replacement or refund as set out in the refund policy. For what each stage means, read Understanding order stages and the Project Flow.
Needs you: nothing falls through the cracks
A section called Needs you lists anything waiting on your side, such as content to add, a draft to approve or an invoice to pay. Each item has a direct button, so you go straight to the task. Below it you will find the latest messages from the team. If you want the same alerts outside the page, turn on browser notifications.
Popular in your industry and milestones
Each day the dashboard suggests well-known publications in your categories that you are not on yet. Press Select on any suggestion, then Review selected to start an order. It is a quick way to widen coverage without searching from scratch. If you prefer a guided approach, the Find my sites quiz recommends sites from a few short questions.
Milestones track your progress to 1, 5, 10, 25, 50 and 100 publications. Alongside them you can see your average and highest DR, how many of your links are do-follow and how many countries you have reached. These are useful when you want to show a pattern, for example that your coverage is moving from local to international outlets.
Using the dashboard as your reporting tool
- Open the dashboard at the end of the month.
- Press Download list to export the live links.
- Add the headline numbers and the logo wall to your report or slide.
- Check Needs you and Popular in your industry for the next step.
This keeps one source of truth. The same data sits behind your orders and your payments, so numbers stay consistent.
Reading the numbers with care
The dashboard turns many details into a few figures, so it helps to know what each one is and is not. Links published counts live articles, not attempts. Total invested reflects invoices you have paid, so it only changes after payment. Cost per link divides one by the other, which makes it a rough average: a single premium placement and several smaller ones will blend together.
DR and readership come from outside tools and from the publications themselves. They can move up or down over time, and Coneberry does not guarantee them. The same applies to results you might hope for, such as indexing on Google or rankings: these depend on the search engines and are never guaranteed. What the dashboard does show with certainty is the list of live links, because each one has been posted in your order chat and can be opened with a click. Coneberry also checks sample links weekly and replaces any that break.
Who should use the dashboard
Founders use it as a scoreboard. Marketing managers use it to build monthly reports. Agencies often keep one account per client and export the link list for each. In every case the habit is the same: look at Needs you first, then Recent updates, then the numbers. That order keeps orders moving, which is what protects your timeline, and leaves the reporting for last.
Frequently asked questions
Do I need to refresh the dashboard to see updates?
No. Recent updates refresh by themselves every few seconds while the page is open.
Can I export my links?
Yes. Download list gives you a CSV, and Copy links copies the live URLs for pasting.
Are the traffic and DR figures guaranteed?
No. They come from third-party tools and publishers and can change. Use them as a guide.
Where do I start a new order?
Press Create new order at the top of the dashboard, or browse the sites directly.
See what you could publish next
You can browse more than 5,000 publications for free, with no account needed, at dashboard.coneberry.com/user/sites. Open a free account when you are ready, and your dashboard will start filling with live links.
More step-by-step help is in the Coneberry Help Center.


